

ToTheMoon is a multifunctional robot, configured according to your trading profile, being able to operate using a Grid and using the average price, or in the conventional way and opening just Single Order in each direction. It has the following indicators as an option for the opening signal or counter signal: Bollinger Bands, Envelopes, Keltner Channels, MACD, RSI, Parabolic, Stochastic, Force Index, Ichimoku, Fractals, Osma, ADX, ATR, STOP ATR, CCI, Moving Averages , VWAP, Hilo, Pivot Point, Support and Resistance, Manual Lines, Candle Sequence, Price GAP, Candle Price Distance, Filter Bollinger Bands, Filter Envelopes, Filter ADX, Filter ATR, Filter Volume, Filter Candle Size, Filter Price GAP and Filter Candle Price Distance, being It is possible to use up to 5 of them at the same time, to define the buy or sell opening. The TakeProfit, StopLoss, BreakEven and Pending Order values are worked virtually by the robot itself, in the Metatrader terminal, remaining invisible to the broker.
Operation
The basic operation of the robot is:
Open orders according to the indicator signal.
If you are in Grid mode, you will open other orders in the same direction if the price passes the Grid step.
If you are in Single Order mode, you will open only one order in each direction.
If you are in Multi Symbols mode, you will use profitable orders to partially close the order at a loss, using the strategy defined in Multi Symbols mode.
If you are in Multi Symbols mode, but are using each symbol separately, you will use profitable orders to partially close the order at a loss, using the strategy defined in Grid or Single Order mode.
You can define several blocks to stop opening orders, according to the drawdown, number of orders, lots, time, etc.
You can define several types of StopLoss.
Grid Mode
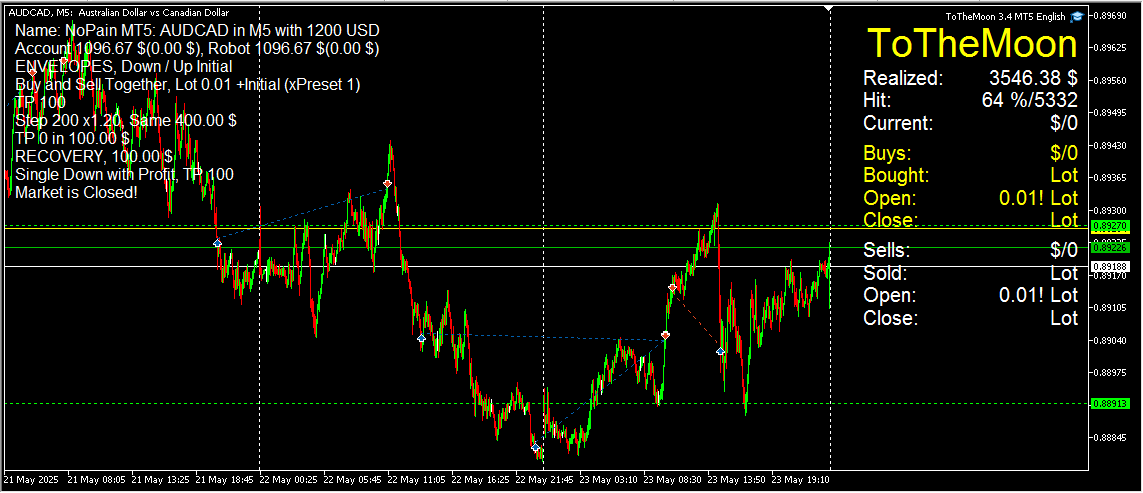
The next figure is the screen with ToTheMoon information in Grid mode. The panel on the right shows the profit realized and the hit percentage, obtained by orders already closed, it also shows the current position with open buy and sell lots and the next lots to be opened or closed, obtained by open orders. The information on the left side is some settings chosen in the PRESET and other important information that occurs during the execution of the strategy, such as blocks and balances. The chart shows the buy (blue) and sell (red) lines, with the solid line being the average price of open orders and the dashed line being the TakeProfit of the strategy.
In traditional grid strategies, the Closing Mode typically involves closing all orders at once when the TakeProfit average of all positions is reached, this option is All Buys or Sell. What sets my robot apart is its focus on partial closures, instead of waiting for all orders reach the TakePorfit, it closes a profitable order and simultaneously closes part of a losing order.
The profitable order can be just one (Down) or All Down Profit.
The losing order can be just one (Up) or or all orders that are not profitable (Others). And the size of the lot that will be closed can be:
Total: Total lot size
Initial: Only the Initial lot
Lot: A specific Lot Value
Half: Half of the lot size
Divide: Lot size Divided by a Divisor Value
Orders: Lot size divided by the number of open Orders
I use the terms Up and Down based on Buy orders, for Sell orders, the logic is reversed.
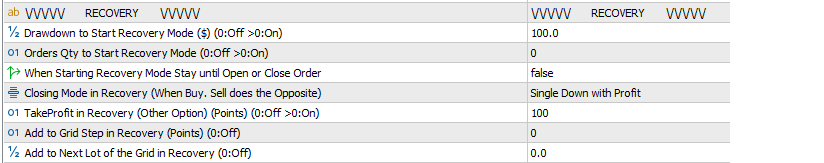
Recovery mode in Grid Mode only:
A Recovery Strategy has been developed. The idea is that when the symbol's price follows a strong trend and moves significantly away from the average price, the Recovery Mode is activated. This mode may or may not create a new TakeProfit and a new Closing Mode, prioritizing the closure of orders that are further from the average price (Down When Buy).
However, the Grid’s standard Closing Mode remains active, ensuring that orders close as soon as they reach the first TakeProfit available.
When Recovery Mode is active, the chart displays average price and TakeProfit lines specific to this mode, using different colors. This allows for a clear visualization of the Grid’s Closing Mode lines versus the Recovery Mode’s Closing Mode lines.
Additionally, there is an option to Add Values to the Grid Step and to the Next Lot. If you want to reduce values, simply input a negative number. This adjustment makes the Grid more or less aggressive, depending on the chosen configuration.
It is important to note that these values are added to the result of the Grid’s rule, not directly to the last opened order.
Example:
If the last order was 0.05, and the next lot calculation indicates a value of 0.06, but a -0.01 adjustment is set for the next lot, then the next lot will be:
0.06 - 0.01 = 0.05
In other words, when adding a negative number, the adjustment is not applied directly to the last opened lot (0.05), but rather to the calculated value for the next lot. If it were applied directly, it would open 0.04, which does not happen in this model. The same logic applies to the calculation of the Grid step.
Multi Symbols
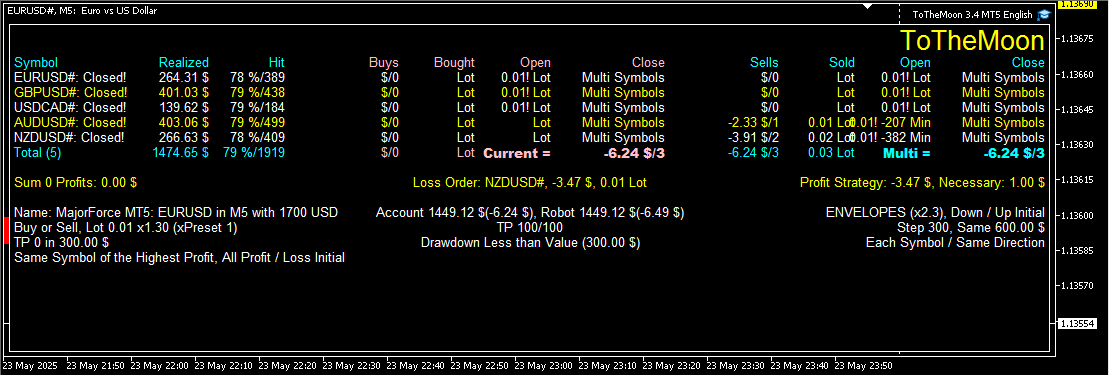
The next figure is the screen operating Multi Symbols. The panel shows data on the symbols in a list, and strategy information, indicating whether orders will be closed using the Multi Symbols mode or separately, using the strategy chosen in the PRESET.
When to use Multi Symbols, drag the robot to just one symbol chart, and the robot will connect and trade the other symbols and show them in the list, choose the symbol on the chart among the symbols that will be used in the PRESET, preferably the one with the most trades and liquidity (ticks).
All symbols will have the same Magic Number chosen in the PRESET.
To properly use my Multi Symbols PRESETS, you may need to adjust the symbol names according to your broker. Some brokers add suffix, prefix, dot, or other variations, altering the symbol names. If this happens, the robot will not be able to locate the symbol, preventing the creation of the panel with the list of symbols on the chart. Additionally, the symbols that were not found will be listed in the "Experts" tab.
If your broker keeps the original symbol names, this adjustment is not necessary.
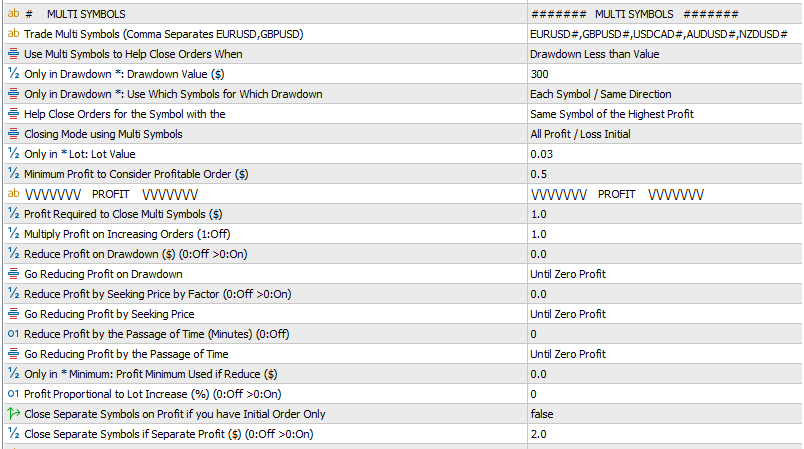
The configuration is done in the variable "Trade Multi Symbols (Comma Separates EURUSD,GBPUSD)”, where the symbol names should be entered exactly as they appear in your broker, including any suffixes, prefixes, or additional characters.
For example, the symbols "EURUSD,AUDCAD" may be displayed differently depending on the broker:
EURUSD#,AUDCAD#
EURUSD.,AUDCAD.
EURUSDe,AUDCADe
The names must be written exactly as they appear in your broker, separated by commas, and respecting uppercase and lowercase letters. Ideally, you should perform a visual mode test to ensure the Multi Symbols screen correctly displays all the chosen symbols in the table.